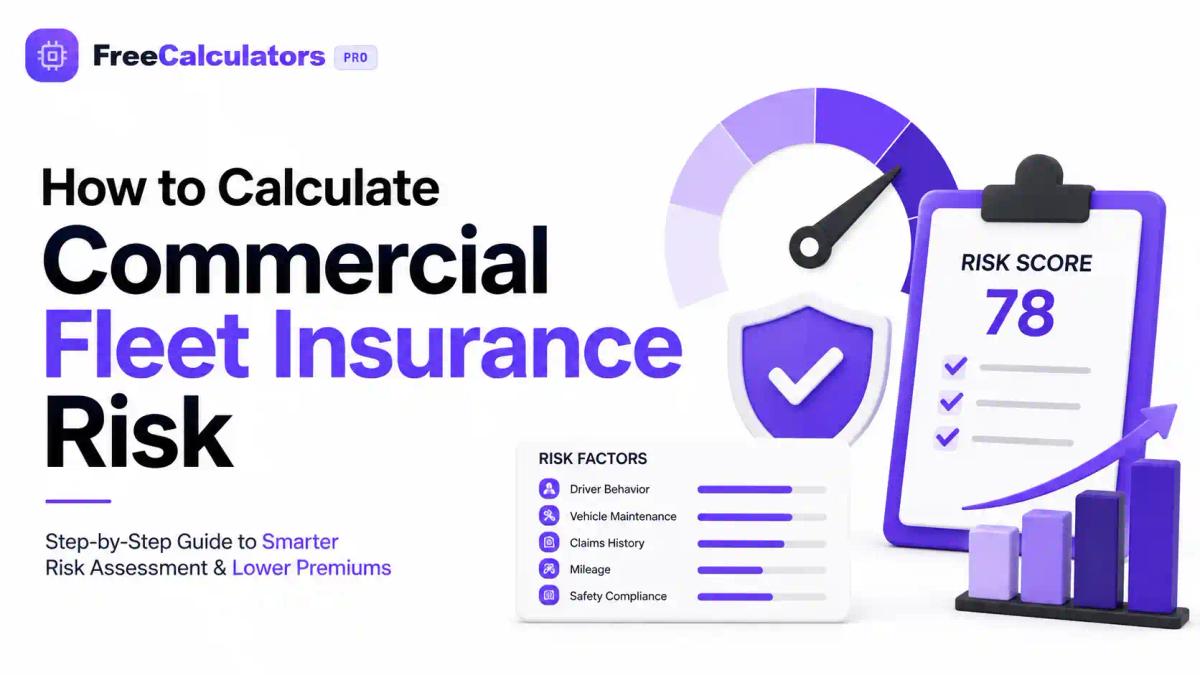
Commercial fleet insurance risk is calculated by combining claims history, driver records, vehicle type and usage, telematics data, and industry exposure into a weighted risk score. Insurers use this score to estimate the probability and cost of future losses, then translate that number into your premium. Fleets with clean safety records, verified maintenance, and telematics monitoring typically pay less.
If you manage a fleet of company vehicles — whether it's three delivery vans or three hundred long-haul trucks — you've probably asked the same question every renewal season: why does my premium look the way it does? The honest answer is that fleet insurance risk isn't a single number pulled from a hat. It's a calculated output, built from dozens of data points that underwriters weigh against actuarial tables and real-world loss trends.
This guide breaks down exactly how insurers calculate commercial fleet insurance risk, what factors move the needle most, and what you can actually do about it. Along the way, we'll point you toward free tools — including several planning calculators on FreeCalculators.tools — that can help you model costs before you ever talk to a broker.
What Is Commercial Fleet Insurance Risk?
Commercial fleet insurance risk is the measurable probability that a business's vehicles will generate an insurance claim, combined with the expected financial severity of that claim. Insurers don't just ask "will something go wrong?" — they ask "how often, and how expensive when it does?"
This is the core distinction underwriters use every day: frequency vs. severity. A fleet of ten sedans used for local sales calls might have a higher frequency of minor fender-benders, but a fleet of five refrigerated trucks hauling perishable cargo across state lines might have lower frequency and far higher severity per incident. Both numbers matter, and both roll into your final fleet underwriting profile.
Why Fleet Insurance Risk Calculation Matters
Understanding how risk is calculated isn't just academic — it directly affects your bottom line. A poorly understood risk profile can mean:
- Overpaying on fleet insurance premiums because you're not getting credit for safety improvements
- Getting non-renewed after a string of claims you didn't see building
- Missing out on usage-based insurance discounts tied to telematics
- Failing to budget accurately for business insurance costs (internal link: business calculator) as your fleet grows
Fleet managers who understand the underwriting variables behind their premium are in a far stronger position to negotiate, self-correct risky patterns, and forecast costs. This is also where a commercial loan calculator (internal link: commercial loan calculator) becomes useful — insurance costs are a real line item when financing new fleet vehicles.
How Fleet Insurance Risk Is Actually Calculated
Insurers build a fleet risk score from several weighted categories. Here's how the major pieces fit together.
1. Claims History and Loss Ratio
Your fleet loss ratio — total claims paid divided by total premiums collected — is one of the single biggest inputs into renewal pricing. A loss ratio under 40% is generally considered favorable; anything consistently above 60% signals to underwriters that current pricing isn't sustainable.
Insurers look at:
- Claims frequency over the past 3–5 years
- Claims severity (average cost per incident)
- At-fault vs. not-at-fault distribution
- Types of claims (collision, cargo, liability, comprehensive)
2. Driver Records and Behavior
Driver behavior monitoring has become one of the most influential underwriting factors. Insurers review:
- Motor Vehicle Records (MVRs) for every listed driver
- Moving violations and at-fault accident history
- CDL status and endorsements for commercial drivers
- Distracted driving indicators from telematics
A fleet with a handful of high-risk drivers can drag the entire risk score upward — even if the rest of the fleet has a clean record.
3. Vehicle Type, Age, and Utilization
Not all vehicles carry the same commercial vehicle insurance risk. Underwriters factor in:
- Vehicle class (light commercial vs. heavy-duty trucks)
- Age and vehicle depreciation curve
- Annual mileage and route risk (urban stop-and-go vs. highway miles)
- Cargo type — hazardous materials or high-value cargo raise cargo risk significantly
4. Telematics and Fleet Safety Data
Fleet telematics has reshaped modern underwriting. GPS tracking, dash cameras, and driver scorecards give insurers real, continuous data instead of relying solely on historical claims. Common telematics inputs include:
- Hard braking and rapid acceleration events
- Speeding patterns relative to posted limits
- Hours of service compliance (tied to DOT compliance)
- Idle time and route efficiency
Platforms like Geotab, Samsara, Motive, Verizon Connect, and Trimble feed this data directly into many insurers' pricing models, often unlocking usage-based insurance (UBI) discounts.
5. Maintenance and Compliance Records
Well-documented fleet maintenance records reduce mechanical-failure-related claims and demonstrate operational discipline. Insurers increasingly ask for:
- Preventive maintenance schedules
- Inspection logs
- FMCSA Safety Measurement System (CSA) scores for trucking fleets
6. Industry and Exposure Type
Fleet exposure analysis accounts for the nature of the business itself. A last-mile delivery company, a construction fleet, and a passenger transport service each carry different baseline risk — independent of how well any single fleet is managed.
The Basic Fleet Insurance Risk Formula
While actual actuarial modeling is proprietary and far more complex, the simplified logic underwriters follow looks like this:
Risk Score = (Claims Frequency × Claims Severity) + Driver Risk Weight + Vehicle Exposure Weight − Safety Credits
Where:
- Safety credits come from telematics adoption, driver training programs, and clean MVRs
- Vehicle exposure weight reflects mileage, vehicle class, and cargo type
- Driver risk weight reflects violations, experience, and CDL status
This score then feeds into exposure rating, which converts risk into a per-vehicle or per-mile premium base before applying industry-specific multipliers.
For a rough starting estimate before speaking with a broker, fleet managers often use a commercial fleet insurance calculator (internal link: car insurance calculator) alongside an auto insurance calculator (internal link: auto insurance calculator) to model per-vehicle cost ranges.
Best Free Tools for Estimating Fleet-Related Costs
While no free tool replaces a licensed underwriter's full assessment, these calculators on FreeCalculators.tools can help you model related costs before renewal:
- Auto Insurance Calculator (internal link: auto insurance calculator) — estimate baseline vehicle insurance costs
- Car Insurance Calculator (internal link: car insurance calculator) — model individual vehicle premiums
- Commercial Loan Calculator (internal link: commercial loan calculator) — plan financing for new fleet vehicles alongside insurance costs
- Business Calculator (internal link: business calculator) — factor insurance into broader operating budgets
- FIRE Calculator (internal link: FIRE calculator) — useful for owner-operators planning long-term financial independence around fleet income
You can browse the full library on the FreeCalculators.tools tools page (internal link: basic calculator / tools directory) for additional planning resources.
Common Mistakes Fleet Managers Make
- Ignoring small claims — even minor, frequent claims damage your loss ratio more than one large infrequent one.
- Not adopting telematics — skipping GPS/dash-cam programs means missing out on measurable safety credits.
- Overlooking driver turnover — new, unvetted drivers can spike your risk score without anyone noticing until renewal.
- Delaying maintenance documentation — insurers can't credit safety practices they can't see.
- Treating fleet insurance as a single annual event — risk should be monitored continuously, not just reviewed at renewal.
- Underestimating cargo and route risk — a new high-value contract or new highway route can change your exposure profile mid-year.
Practical Example
Consider a 25-vehicle regional delivery fleet:
- Before telematics: 3 at-fault accidents/year, loss ratio of 68%, annual premium of $180,000
- After 12 months of telematics + driver coaching: Hard-braking events down 40%, at-fault accidents down to 1/year, loss ratio drops to 45%
At renewal, the insurer applied a safety credit that reduced the premium by roughly 18%, driven almost entirely by measurable driver behavior improvement — not by shopping for a new carrier.
Future Trends in Fleet Insurance Risk Calculation
- AI-assisted underwriting using real-time telematics feeds rather than static annual reviews
- Continuous risk scoring that adjusts pricing throughout the policy term
- ADAS integration (Advanced Driver Assistance Systems) as a formal pricing variable
- Predictive maintenance data feeding directly into underwriting models
- Cyber risk assessment for increasingly connected fleet vehicles
- Autonomous and semi-autonomous fleet insurance frameworks as self-driving technology matures
Regulatory bodies such as the FMCSA, NHTSA, and the National Association of Insurance Commissioners (NAIC) continue to shape how these emerging data sources are standardized across state lines.
FAQ
What is commercial fleet insurance risk? It's the calculated probability and expected cost of insurance claims across a company's vehicle fleet, based on claims history, driver records, vehicle type, and telematics data.
How is commercial fleet insurance risk calculated? Insurers combine claims frequency, claims severity, driver risk, vehicle exposure, and safety credits into a weighted score that determines premium pricing.
What factors influence fleet insurance premiums the most? Claims history and loss ratio typically carry the most weight, followed by driver records, vehicle type, telematics data, and industry exposure.
Can telematics actually lower fleet insurance costs? Yes. Insurers increasingly offer usage-based discounts tied to verified telematics data showing safer driving behavior, reduced hard-braking events, and lower speeding incidents.
What is fleet underwriting? Fleet underwriting is the process insurers use to evaluate a fleet's risk profile and set appropriate premium pricing based on data-driven risk assessment.
How often should fleet risk be reassessed? While formal renewal happens annually, safety-conscious fleets track risk indicators continuously through telematics dashboards and internal safety reporting.
Does vehicle age affect fleet insurance risk? Yes. Older vehicles may have higher mechanical failure risk, while newer vehicles often include safety technology that can reduce accident frequency and severity.
Which industries have the highest fleet insurance risk? Long-haul trucking, construction, and last-mile delivery typically carry higher baseline risk due to mileage, cargo value, and route exposure compared to standard business-use fleets.
What is the difference between fleet insurance and standard commercial auto insurance? Fleet insurance covers multiple vehicles under a single policy with fleet-wide risk pooling, while standard commercial auto insurance is typically written per individual vehicle.
Can AI predict fleet insurance risk accurately? AI-assisted models are improving rapidly, especially when combined with real-time telematics, but they currently supplement — rather than fully replace — traditional actuarial underwriting.
Key Takeaways
- Fleet insurance risk is a calculated score, not a guess — built from claims, drivers, vehicles, and telematics data
- Loss ratio is one of the most influential factors in renewal pricing
- Telematics adoption can measurably lower premiums through safety credits
- Driver behavior monitoring matters as much as vehicle type
- Maintenance documentation directly supports lower risk scoring
- Industry type sets a baseline exposure level independent of individual fleet management
- AI and continuous risk scoring are reshaping the future of fleet underwriting
Expert Summary
Commercial fleet insurance risk is determined through a structured underwriting process that weighs claims history, driver behavior, vehicle exposure, and increasingly, telematics data. Loss ratio and claims frequency remain foundational, but safety credits from GPS tracking, driver coaching, and documented maintenance are playing a larger role each year. Fleet managers who actively monitor these variables — rather than waiting for renewal surprises — are best positioned to control costs. As AI-assisted underwriting and continuous risk scoring mature, fleets with strong data hygiene and safety programs will increasingly outperform those relying on reactive risk management.
Conclusion
Calculating commercial fleet insurance risk isn't guesswork — it's a data-driven process built on claims history, driver behavior, vehicle exposure, and increasingly, telematics. The fleets that manage this well aren't necessarily the smallest or newest; they're the ones that treat risk as something to monitor continuously rather than react to once a year.
Call to Action
Ready to plan your fleet's insurance and financing costs with confidence? Explore the free commercial fleet insurance calculator , auto insurance calculator , and commercial loan calculator on FreeCalculators.tools — your trusted destination for free online financial calculators and planning tools. Visit the FreeCalculators.tools blog for more guides on business finance, insurance, and planning, or check out our related read on how much term life insurance you need in 2026 .